これは、なにをしたくて書いたもの?
WildFlyでメトリクスを取得してみたいな、と。
環境
今回の環境は、こちら。
$ java --version
openjdk 11.0.11 2021-04-20
OpenJDK Runtime Environment (build 11.0.11+9-Ubuntu-0ubuntu2.20.04)
OpenJDK 64-Bit Server VM (build 11.0.11+9-Ubuntu-0ubuntu2.20.04, mixed mode, sharing)


$ mvn --version
Apache Maven 3.8.1 (05c21c65bdfed0f71a2f2ada8b84da59348c4c5d)
Maven home: $HOME/.sdkman/candidates/maven/current
Java version: 11.0.11, vendor: Ubuntu, runtime: /usr/lib/jvm/java-11-openjdk-amd64
Default locale: ja_JP, platform encoding: UTF-8
OS name: "linux", version: "5.4.0-81-generic", arch: "amd64", family: "unix"
WildFlyは、24.0.1.Finalを使用します。
$ curl -OL https://download.jboss.org/wildfly/24.0.1.Final/wildfly-24.0.1.Final.zip
$ unzip wildfly-24.0.1.Final.zip
$ cd wildfly-24.0.1.Final
取得したメトリクスはPrometheus(2.29.1)に保存することにします。こちらは、172.17.0.2で動作しているものとします。
また、WildFlyは172.17.0.1で動作しているものとします。
MetricsサブシステムとMicroProfile Metricsサブシステム
WildFlyでのMetricsサブシステムに関するドキュメントはこちら。
Metrics Subsystem Configuration
MicroProfile Metricsサブシステムに関するドキュメントはこちら。
※なぜかMetricsサブシステムと同じidが振られているので、MicroProfile Metricsサブシステムの「Required Extension」に合わせて
おきました
MicroProfile Metrics Subsystem Configuration / Required Extension
この両者、パッと見では書いている情報がほとんど同じで違いがわかりません。
メトリクスを取得する際のHTTPエンドポイントも同じで、サブシステムで設定する属性も同じです。
どちらもHTTPエンドポイントで公開されてるメトリクスは、Prometheusフォーマットでの出力になります。
まず、起動する時のサーバー設定でどちらになるかが決まるようですね。
MicroProfile Metricsサブシステムを使うには、standalone-microprofileと付くものを選ぶ必要があります。
MicroProfile Metricsサブシステムではエクステンションが必要だからですね。
MicroProfile Metrics Subsystem Configuration / Required Extension
違いは、よく見るとMetricsサブシステムの方に最初に書いてあります。
This subsystem exposes only base metrics from the WildFly Management Model and JVM MBeans.
Metricsサブシステムは、WildFlyおよびJVMの基本的なメトリクスのみを公開するサブシステムのようです。
Metricsサブシステムは、MicroProfile Metricsサブシステムが入った後に追加されたようで(WildFly 22)、
MicroProfile Metricsサブシステムの基盤となっていることが書かれています。MicroProfile Metricsを使って追加される、
カスタムメトリクスが不要な場合はMetricsサブシステムで十分だという感じですね。
New base health and base metrics subsystems are available. These provide a foundation for updated versions of the corresponding 'microprofile-health-smallrye' and 'microprofile-metrics-smallrye' subsystems. They also allow users who don’t need the custom deployment-specific health and metrics information provided by Eclipse MicroProfile Health and Metrics to still get general server health and metrics information via the management endpoint without needing to include the MicroProfile Health and Metrics libraries in their server installation.
Metricsサブシステムが公開するメトリクスは、JVMの基本的なメトリクスとWildFlyに関するメトリクスの2つです。
- Base metrics - Metrics from JVM MBeans (read from their JMX MBeans)
- Vendor metrics - WildFly Metrics from the management model subsystem and deployment subtrees.
Metrics Subsystem Configuration / Exposed Metrics
WildFlyのメトリクスについては、こちらに記載があります。
WildFlyのメトリクスは、メトリクスを公開するサブシステムおよび管理モデルの属性名がベースになっているそうです。
たとえばUndertowのrequest-countというメトリクスはwildfly_undertow_request_countという名前で公開されます。
また、一部のサブシステムはメトリクスを取得できるようにするためには、statistics-enabledをtrueとする必要が
あります。パフォーマンスおよびメモリ使用量に影響するからだそうです。
statistics-enabledを持つサブシステムは、以下の4つです(データソースとInfinispanは、データソースやCache Container単位)。
- subsystem=transactions
- subsystem=datasources / data-source=ExampleDS
- subsystem=infinispan / cache-container
- subsystem=infinispan / remote-cache-container
- subsystem=undertow
一方で、MicroProfile Metricsサブシステムが公開するメトリクスは、次の3つになります。
- Base metrics - Required metrics specified in the MicroProfile 1.1 specification are exposed in the base scope.
- Vendor metrics - Vendor-specific metrics (e.g. for memory pools)
- Application metrics - Metrics from the application and from the deployment’s subsystems are exposed in the application scope.
MicroProfile Metrics Subsystem Configuration / Exposed Metrics
アプリケーションのメトリクスを含めることができるのが、Metricsサブシステムとの違いのようですね。
もっとも、MicroProfile Metricsについては自分は今時点ではまったく知らないので、今回は踏み込まずにいきます…。
準備
メトリクス取得用のユーザーを追加しておきます。
$ bin/add-user.sh -u metrics-subscriber -p password
起動は、各サブシステムについて書く時に行いましょう。
あと、確認のために簡単なWebアプリケーションも作成しましょう。
pom.xml
<?xml version="1.0" encoding="UTF-8"?>
<project xmlns="http://maven.apache.org/POM/4.0.0"
         xmlns:xsi="http://www.w3.org/2001/XMLSchema-instance"
         xsi:schemaLocation="http://maven.apache.org/POM/4.0.0 http://maven.apache.org/xsd/maven-4.0.0.xsd">
    <modelVersion>4.0.0</modelVersion>

    <groupId>org.example</groupId>
    <artifactId>simple-jaxrs</artifactId>
    <version>0.0.1-SNAPSHOT</version>
    <packaging>war</packaging>

    <properties>
        <project.build.sourceEncoding>UTF-8</project.build.sourceEncoding>
        <project.reporting.outputEncoding>UTF-8</project.reporting.outputEncoding>
        <maven.compiler.source>11</maven.compiler.source>
        <maven.compiler.target>11</maven.compiler.target>
        <failOnMissingWebXml>false</failOnMissingWebXml>
    </properties>

    <dependencies>
        <dependency>
            <groupId>jakarta.platform</groupId>
            <artifactId>jakarta.jakartaee-web-api</artifactId>
            <version>8.0.0</version>
            <scope>provided</scope>
        </dependency>
    </dependencies>

    <build>
        <finalName>ROOT</finalName>
    </build>
</project>
簡単なJAX-RSリソースクラス。
src/main/java/org/littlewings/jakartaee/HelloResource.java
package org.littlewings.jakartaee;

import javax.ws.rs.GET;
import javax.ws.rs.Path;
import javax.ws.rs.Produces;
import javax.ws.rs.core.MediaType;

@Path("hello")
public class HelloResource {
    @GET
    @Produces(MediaType.TEXT_PLAIN)
    public String message() {
        return "Hello World!!";
    }
}
JAX-RS有効化用のクラス。
src/main/java/org/littlewings/jakartaee/JaxrsActivator.java
package org.littlewings.jakartaee;

import javax.ws.rs.ApplicationPath;
import javax.ws.rs.core.Application;

@ApplicationPath("")
public class JaxrsActivator extends Application {
}
パッケージングしておきます。
$ mvn package
できあがるのは、ROOT.warというファイルです。
Metricsサブシステムを使う
まずは、WildFlyをスタンドアロンモードで起動します。最後に別ホストからPrometheusでアクセスするので、
-bmanagement=0.0.0.0も指定しておきます。
$ bin/standalone.sh -bmanagement=0.0.0.0
管理CLIにログイン。
$ bin/jboss-cli.sh -c
アプリケーションをデプロイします。
[standalone@localhost:9990 /] deploy /path/to/target/ROOT.war
確認。
$ curl localhost:8080/hello
Hello World!!
ここから、いろいろ試していってみます。
Metricsサブシステムについては、デフォルトで入っているようですね。
$ grep 'metrics' standalone/configuration/standalone.xml
        <extension module="org.wildfly.extension.metrics"/>
        <subsystem xmlns="urn:wildfly:metrics:1.0" security-enabled="false" exposed-subsystems="*" prefix="${wildfly.metrics.prefix:wildfly}"/>
最初から、メトリクスが取得できます。
※Metricsサブシステムとorg.wildfly.extension.metricsエクステンションが必要です
メトリクス取得を行うには、管理系のポートである9990の/metricsへHTTPアクセスします。
$ curl -si localhost:9990/metrics
HTTP/1.1 200 OK
Connection: keep-alive
Content-Length: 37870
Date: Sat, 14 Aug 2021 18:58:19 GMT

# HELP base_classloader_loadedClasses_total Displays the total number of classes that have been loaded since the Java virtual machine has started execution.
# TYPE base_classloader_loadedClasses_total counter
base_classloader_loadedClasses_total 20369.0
# HELP base_classloader_loadedClasses_count Displays the number of classes that are currently loaded in the Java virtual machine.
# TYPE base_classloader_loadedClasses_count gauge
base_classloader_loadedClasses_count 20226.0
# HELP base_classloader_unloadedClasses_total Displays the total number of classes unloaded since the Java virtual machine has started execution.
# TYPE base_classloader_unloadedClasses_total counter
base_classloader_unloadedClasses_total 143.0
# HELP base_cpu_availableProcessors Displays the number of processors available to the Java virtual machine. This value may change during a particular invocation of the virtual machine.
# TYPE base_cpu_availableProcessors gauge
base_cpu_availableProcessors 8.0
# HELP base_cpu_processCpuLoad Displays the "recent cpu usage" for the Java Virtual Machine process.
# TYPE base_cpu_processCpuLoad gauge
base_cpu_processCpuLoad 0.0423728813559322

〜
189メトリクスあるようです。ちなみに、アプリケーションをデプロイする前に数えたら、175メトリクスでした。
まあ、数は参考ですね。
$ curl -s localhost:9990/metrics | grep -v '^#' | wc -l
189
ちょっとまとめて見てみましょう。こんな感じでした。
$ curl -s localhost:9990/metrics | grep -v '^#' | perl -wp -e 's!^(.+?_.+?)_.+!$1!' | sort | uniq -c
      3 base_classloader
      4 base_cpu
      4 base_gc
      1 base_jvm
      6 base_memory
      3 base_thread
      2 vendor_BufferPool
     16 vendor_memoryPool
      7 wildfly_batch
     60 wildfly_datasources
     14 wildfly_ee
      7 wildfly_ejb3
      2 wildfly_infinispan
      7 wildfly_io
     17 wildfly_jca
      1 wildfly_request
     11 wildfly_transactions
     24 wildfly_undertow
サブシステム単位のメトリクスも見てみましょう。
Undertowサブシステム。
$ curl -s localhost:9990/metrics | grep -v '^#' | grep undertow
wildfly_undertow_active_sessions{deployment="ROOT.war",subdeployment="ROOT.war"} 0.0
wildfly_undertow_bytes_received_total_bytes{server="default-server",http_listener="default"} 0.0
wildfly_undertow_bytes_received_total_bytes{server="default-server",https_listener="https"} 0.0
wildfly_undertow_bytes_sent_total_bytes{server="default-server",http_listener="default"} 0.0
wildfly_undertow_bytes_sent_total_bytes{server="default-server",https_listener="https"} 0.0
wildfly_undertow_error_count_total{server="default-server",http_listener="default"} 0.0
wildfly_undertow_error_count_total{server="default-server",https_listener="https"} 0.0
wildfly_undertow_expired_sessions_total{deployment="ROOT.war",subdeployment="ROOT.war"} 0.0
wildfly_undertow_highest_session_count{deployment="ROOT.war",subdeployment="ROOT.war"} 0.0
wildfly_undertow_max_active_sessions{deployment="ROOT.war",subdeployment="ROOT.war"} -1.0
wildfly_undertow_max_processing_time_seconds{server="default-server",http_listener="default"} 0.0
wildfly_undertow_max_processing_time_seconds{server="default-server",https_listener="https"} 0.0
wildfly_undertow_max_request_time_seconds{deployment="ROOT.war",servlet="org.littlewings.jakartaee.JaxrsActivator",subdeployment="ROOT.war"} 0.0
wildfly_undertow_min_request_time_seconds{deployment="ROOT.war",servlet="org.littlewings.jakartaee.JaxrsActivator",subdeployment="ROOT.war"} 0.0
wildfly_undertow_processing_time_total_seconds{server="default-server",http_listener="default"} 0.0
wildfly_undertow_processing_time_total_seconds{server="default-server",https_listener="https"} 0.0
wildfly_undertow_rejected_sessions_total{deployment="ROOT.war",subdeployment="ROOT.war"} 0.0
wildfly_undertow_request_count_total{server="default-server",http_listener="default"} 0.0
wildfly_undertow_request_count_total{server="default-server",https_listener="https"} 0.0
wildfly_undertow_request_count_total{deployment="ROOT.war",servlet="org.littlewings.jakartaee.JaxrsActivator",subdeployment="ROOT.war"} 0.0
wildfly_undertow_session_avg_alive_time_seconds{deployment="ROOT.war",subdeployment="ROOT.war"} 0.0
wildfly_undertow_session_max_alive_time_seconds{deployment="ROOT.war",subdeployment="ROOT.war"} 0.0
wildfly_undertow_sessions_created_total{deployment="ROOT.war",subdeployment="ROOT.war"} 0.0
wildfly_undertow_total_request_time_total_seconds{deployment="ROOT.war",servlet="org.littlewings.jakartaee.JaxrsActivator",subdeployment="ROOT.war"} 0.0
デプロイされたアプリケーションの情報も見えますね。ただ、アプリケーションにアクセスしたはずなのに
wildfly_undertow_request_count_totalの数が増えていませんね…?
IOサブシステム。
$ curl -s localhost:9990/metrics | grep -v '^#' | grep io_
wildfly_io_busy_task_thread_count{worker="default"} 0.0
wildfly_io_connection_count{worker="default",server="/127.0.0.1:8080"} 0.0
wildfly_io_connection_count{worker="default",server="/127.0.0.1:8443"} 0.0
wildfly_io_core_pool_size{worker="default"} 2.0
wildfly_io_io_thread_count{worker="default"} 16.0
wildfly_io_max_pool_size{worker="default"} 128.0
wildfly_io_queue_size{worker="default"} 0.0
Undertowサブシステムやデータソースいった、明示的に有効にしないと取得できないはずのサブシステムのメトリクスも
見えてはいました。ただ、メトリクスの値そのものは入っていなさそうです。
ドキュメントによると、スタンドアロンモードの場合は以下のシステムプロパティを有効にすればよさそうです。
-Dwildfly.statistics-enabled=true
ドキュメントにも書いてありますね。
For convenience, WildFly standalone configuration provides expressions to enable the statistics by setting a System property -Dwildfly.statistics-enabled=true to enable statistics on the subsystems provided by the configuration.
ドメインモードの場合は、ちゃんと確認した方がよいでしょう。
wildfly.statistics-enabledシステムプロパティを参照している設定は、これくらいのようです。
$ grep wildfly.statistics-enabled standalone/configuration/standalone.xml
                <datasource jndi-name="java:jboss/datasources/ExampleDS" pool-name="ExampleDS" enabled="true" use-java-context="true" statistics-enabled="${wildfly.datasources.statistics-enabled:${wildfly.statistics-enabled:false}}">
            <statistics enabled="${wildfly.ejb3.statistics-enabled:${wildfly.statistics-enabled:false}}"/>
            <coordinator-environment statistics-enabled="${wildfly.transactions.statistics-enabled:${wildfly.statistics-enabled:false}}"/>
        <subsystem xmlns="urn:jboss:domain:undertow:12.0" default-server="default-server" default-virtual-host="default-host" default-servlet-container="default" default-security-domain="other" statistics-enabled="${wildfly.undertow.statistics-enabled:${wildfly.statistics-enabled:false}}">
        <subsystem xmlns="urn:jboss:domain:webservices:2.0" statistics-enabled="${wildfly.webservices.statistics-enabled:${wildfly.statistics-enabled:false}}">
というわけで、-Dwildfly.statistics-enabled=trueを付与してWildFlyを起動しなおしてみます。
$ bin/standalone.sh -bmanagement=0.0.0.0 -Dwildfly.statistics-enabled=true
今度は、メトリクスに値が入るようになります。wildfly_undertow_request_count_totalでの例。
$ curl -s localhost:9990/metrics | grep -v '^#' | grep undertow | grep request_count
wildfly_undertow_request_count_total{server="default-server",http_listener="default"} 2.0
wildfly_undertow_request_count_total{server="default-server",https_listener="https"} 0.0
wildfly_undertow_request_count_total{deployment="ROOT.war",servlet="org.littlewings.jakartaee.JaxrsActivator",subdeployment="ROOT.war"} 2.0
もちろん、個々のサブシステムについてstatistics-enabledを明示的にtrueにしてもOKです。
[standalone@localhost:9990 /] /subsystem=undertow:write-attribute(name=statistics-enabled,value=true)
{"outcome" => "success"}
次に、認証を有効にしてみましょう。まずは、現在のMetricsサブシステムの状態を確認。
[standalone@localhost:9990 /] /subsystem=metrics:read-resource(include-runtime)
{
    "outcome" => "success",
    "result" => {
        "exposed-subsystems" => ["*"],
        "prefix" => expression "${wildfly.metrics.prefix:wildfly}",
        "security-enabled" => false
    }
}
exposed-subsystemsというのは、メトリクスを公開するサブシステムです。デフォルトは*で、すべてのサブシステムの
メトリクスが公開されます。メトリクスを公開するサブシステムを絞り込みたい場合は、この属性にサブシステム名を
リストで指定します。
認証を有効にするには、security-enabledをtrueに変更します。
[standalone@localhost:9990 /] /subsystem=metrics:write-attribute(name=security-enabled,value=true)
{
    "outcome" => "success",
    "response-headers" => {
        "operation-requires-reload" => true,
        "process-state" => "reload-required"
    }
}
再起動を求められるので、reloadします。
[standalone@localhost:9990 /] reload
メトリクスのHTTPエンドポイントにアクセスすると、401が返ります。
$ curl -si localhost:9990/metrics
HTTP/1.1 401 Unauthorized
Connection: keep-alive
WWW-Authenticate: Digest realm="ManagementRealm", nonce="AAAAAQAADDP2CJ0u5cV6X8Ln45qtgyUfGA8UEZtIrIj6rS/K0eA0RPgsM7g=", opaque="00000000000000000000000000000000", algorithm=MD5, qop=auth
Content-Length: 77
Content-Type: text/html
Date: Sat, 14 Aug 2021 13:21:00 GMT

<html><head><title>Error</title></head><body>401 - Unauthorized</body></html>
Digest認証でアクセスすればOKです。
$ curl -s --digest -u metrics-subscriber:password localhost:9990/metrics
最後に、Prometheusからアクセスしてみましょう。PrometheusはDigest認証には対応していないようなので、
メトリクスのエンドポイントから認証を外します。
[standalone@localhost:9990 /] /subsystem=metrics:write-attribute(name=security-enabled,value=false)
{
    "outcome" => "success",
    "response-headers" => {
        "operation-requires-reload" => true,
        "process-state" => "reload-required"
    }
}

[standalone@localhost:9990 /] reload
Prometheusの設定は、こんな感じで準備。
prometheus.yml
global:
  scrape_interval: 5s
  evaluation_interval: 5s

scrape_configs:
  - job_name: "prometheus"
    static_configs:
      - targets: ["localhost:9090"]
  - job_name: "wildfly"
    static_configs:
      - targets: ["172.17.0.1:9990"]
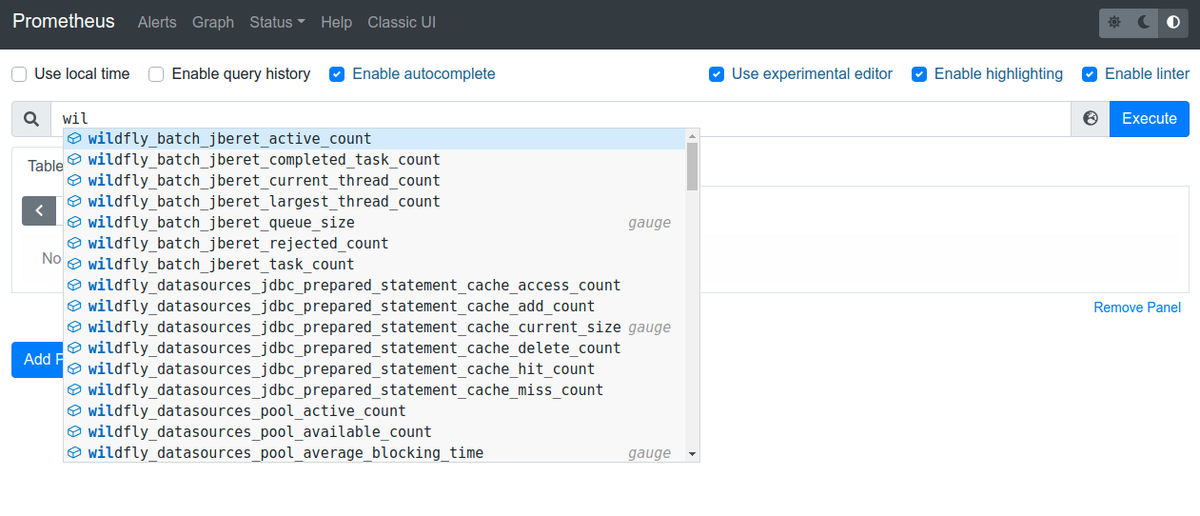
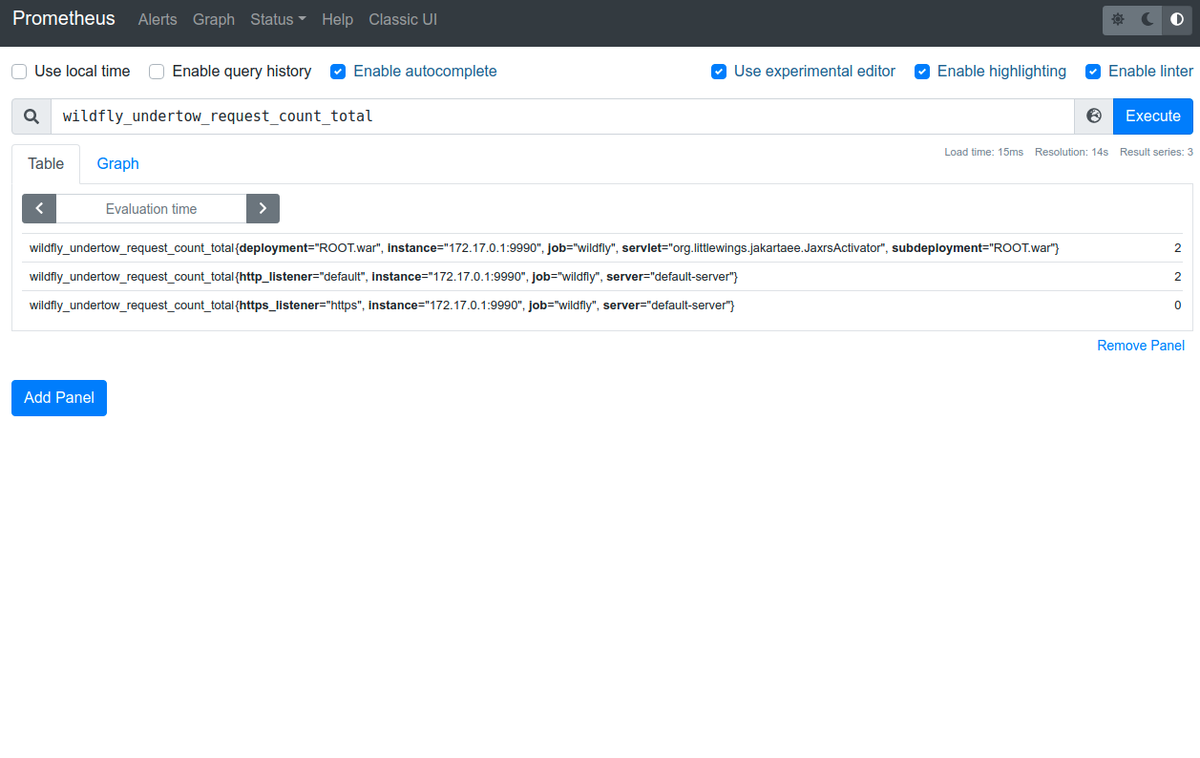
結果。ちゃんと取得できていますね。
ところで、MetricsサブシステムのHTTPエンドポイントが/metricsだったので特にPrometheusでもパスの指定は
不要でしたが、こちらは変更できないのでしょうか?
見たところ、変更できなさそうですね…。
private static final String CONTEXT_NAME = "/metrics";
    @Override
    public void start(StartContext context) {
        extensibleHttpManagement.get().addManagementHandler(CONTEXT_NAME, securityEnabledSupplier.get(), new HttpHandler() {
            @Override
            public void handleRequest(HttpServerExchange exchange) throws Exception {
                if (overrideableMetricHandler != null) {
                    overrideableMetricHandler.handleRequest(exchange);
                    return;
                }

                WildFlyMetricRegistry metricRegistry = wildflyMetricRegistry.get();
                metricRegistry.readLock();
                try {
                    String wildFlyMetrics = prometheusExporter.export(metricRegistry);
                    exchange.getResponseSender().send(wildFlyMetrics);
                } finally {
                    metricRegistry.unlock();
                }
            }
        });
        consumer.accept(this);
    }
こういうものだ、と思っておきましょう。
MicroProfile Metricsサブシステムを使う
次は、MicroProfile Metricsサブシステムを使いましょう。
WildFlyはもう1度新しく準備しなおしました。
起動時の設定ファイルに、今回はstandalone-microprofile.xmlを指定します。-Dwildfly.statistics-enabled=trueも最初から
指定しておきましょう。
$ bin/standalone.sh -c standalone-microprofile.xml -bmanagement=0.0.0.0 -Dwildfly.statistics-enabled=true
管理CLIにもログインして、アプリケーションもデプロイしておきます。
$ bin/jboss-cli.sh -c
[standalone@localhost:9990 /] deploy /path/to/target/ROOT.war
確認。
$ curl localhost:8080/hello
Hello World!!
まずはメトリクスが取得できることを確認します。
$ curl -si localhost:9990/metrics
HTTP/1.1 200 OK
Access-Control-Allow-Headers: origin, content-type, accept, authorization
Date: Sat, 14 Aug 2021 19:23:07 GMT
Connection: keep-alive
Access-Control-Allow-Origin: *
Access-Control-Allow-Credentials: true
Content-Type: text/plain
Content-Length: 45917
Access-Control-Allow-Methods: GET, POST, PUT, DELETE, OPTIONS, HEAD
Access-Control-Max-Age: 1209600

# HELP base_classloader_loadedClasses_count Displays the number of classes that are currently loaded in the Java virtual machine.
# TYPE base_classloader_loadedClasses_count gauge
base_classloader_loadedClasses_count 16225.0
# HELP base_classloader_loadedClasses_total Displays the total number of classes that have been loaded since the Java virtual machine has started execution.
# TYPE base_classloader_loadedClasses_total counter
base_classloader_loadedClasses_total 16236.0
# HELP base_classloader_unloadedClasses_total Displays the total number of classes unloaded since the Java virtual machine has started execution.
# TYPE base_classloader_unloadedClasses_total counter
base_classloader_unloadedClasses_total 11.0

〜省略〜
見た感じ、Metricsサブシステムの時と変わりませんね。
$ curl -s localhost:9990/metrics | grep -v '^#' | perl -wp -e 's!^(.+?_.+?)_.+!$1!' | sort | uniq -c
      3 base_classloader
      4 base_cpu
      4 base_gc
      1 base_jvm
      6 base_memory
      3 base_thread
      2 vendor_BufferPool
     16 vendor_memoryPool
     60 wildfly_datasources
     14 wildfly_ee
      7 wildfly_io
     17 wildfly_jca
     12 wildfly_messaging
      1 wildfly_request
     11 wildfly_transactions
     24 wildfly_undertow
ただ、よく見るとmicroprofile_scopeというラベルが追加されていますね。
$ curl -s localhost:9990/metrics | grep -v '^#' | grep undertow
wildfly_undertow_active_sessions{deployment="ROOT.war",subdeployment="ROOT.war",microprofile_scope="vendor"} 0.0
wildfly_undertow_bytes_received_total_bytes{http_listener="default",server="default-server",microprofile_scope="vendor"} 332.0
wildfly_undertow_bytes_received_total_bytes{https_listener="https",server="default-server",microprofile_scope="vendor"} 0.0
wildfly_undertow_bytes_sent_total_bytes{http_listener="default",server="default-server",microprofile_scope="vendor"} 612.0
wildfly_undertow_bytes_sent_total_bytes{https_listener="https",server="default-server",microprofile_scope="vendor"} 0.0
wildfly_undertow_error_count_total{http_listener="default",server="default-server",microprofile_scope="vendor"} 0.0
wildfly_undertow_error_count_total{https_listener="https",server="default-server",microprofile_scope="vendor"} 0.0
wildfly_undertow_expired_sessions_total{deployment="ROOT.war",subdeployment="ROOT.war",microprofile_scope="vendor"} 0.0
wildfly_undertow_highest_session_count{deployment="ROOT.war",subdeployment="ROOT.war",microprofile_scope="vendor"} 0.0
wildfly_undertow_max_active_sessions{deployment="ROOT.war",subdeployment="ROOT.war",microprofile_scope="vendor"} -1.0
wildfly_undertow_max_processing_time_seconds{http_listener="default",server="default-server",microprofile_scope="vendor"} 0.0
wildfly_undertow_max_processing_time_seconds{https_listener="https",server="default-server",microprofile_scope="vendor"} 0.0
wildfly_undertow_max_request_time_seconds{deployment="ROOT.war",servlet="org.littlewings.jakartaee.JaxrsActivator",subdeployment="ROOT.war",microprofile_scope="vendor"} 0.083
wildfly_undertow_min_request_time_seconds{deployment="ROOT.war",servlet="org.littlewings.jakartaee.JaxrsActivator",subdeployment="ROOT.war",microprofile_scope="vendor"} 0.001
wildfly_undertow_processing_time_total_seconds{http_listener="default",server="default-server",microprofile_scope="vendor"} 0.0
wildfly_undertow_processing_time_total_seconds{https_listener="https",server="default-server",microprofile_scope="vendor"} 0.0
wildfly_undertow_rejected_sessions_total{deployment="ROOT.war",subdeployment="ROOT.war",microprofile_scope="vendor"} 0.0
wildfly_undertow_request_count_total{http_listener="default",server="default-server",microprofile_scope="vendor"} 4.0
wildfly_undertow_request_count_total{https_listener="https",server="default-server",microprofile_scope="vendor"} 0.0
wildfly_undertow_request_count_total{deployment="ROOT.war",servlet="org.littlewings.jakartaee.JaxrsActivator",subdeployment="ROOT.war",microprofile_scope="vendor"} 4.0
wildfly_undertow_session_avg_alive_time_seconds{deployment="ROOT.war",subdeployment="ROOT.war",microprofile_scope="vendor"} 0.0
wildfly_undertow_session_max_alive_time_seconds{deployment="ROOT.war",subdeployment="ROOT.war",microprofile_scope="vendor"} 0.0
wildfly_undertow_sessions_created_total{deployment="ROOT.war",subdeployment="ROOT.war",microprofile_scope="vendor"} 0.0
wildfly_undertow_total_request_time_total_seconds{deployment="ROOT.war",servlet="org.littlewings.jakartaee.JaxrsActivator",subdeployment="ROOT.war",microprofile_scope="vendor"} 0.088
MicroProfile Metricsサブシステムの現在の設定。
[standalone@localhost:9990 /] /subsystem=microprofile-metrics-smallrye:read-resource(include-runtime)
{
    "outcome" => "success",
    "result" => {
        "exposed-subsystems" => ["*"],
        "prefix" => expression "${wildfly.metrics.prefix:wildfly}",
        "security-enabled" => false
    }
}
ちなみに、Metricsサブシステムもふつうに存在します。
[standalone@localhost:9990 /] /subsystem=metrics:read-resource(include-runtime)
{
    "outcome" => "success",
    "result" => {
        "exposed-subsystems" => ["*"],
        "prefix" => expression "${wildfly.metrics.prefix:wildfly}",
        "security-enabled" => false
    }
}
MicroProfile Metricsサブシステムの認証を有効にしてみましょう。合わせて再起動も行います。
[standalone@localhost:9990 /] /subsystem=microprofile-metrics-smallrye:write-attribute(name=security-enabled,value=true)
{
    "outcome" => "success",
    "response-headers" => {
        "operation-requires-reload" => true,
        "process-state" => "reload-required"
    }
}

[standalone@localhost:9990 /] reload
認証が求められるようになるので
$ curl -si localhost:9990/metrics
HTTP/1.1 401 Unauthorized
Connection: keep-alive
WWW-Authenticate: Digest realm="ManagementRealm", nonce="AAAAAQAAIDy42i52ZRi3e3Pnw/HhU7RHlKBleJQm4hKV/pE6bwoV0l6DtSw=", opaque="00000000000000000000000000000000", algorithm=MD5, qop=auth
Content-Length: 77
Content-Type: text/html
Date: Sat, 14 Aug 2021 19:28:08 GMT

<html><head><title>Error</title></head><body>401 - Unauthorized</body></html>
Digest認証でログイン情報を指定すれば、OKです。
$ curl -si --digest -u metrics-subscriber:password localhost:9990/metrics
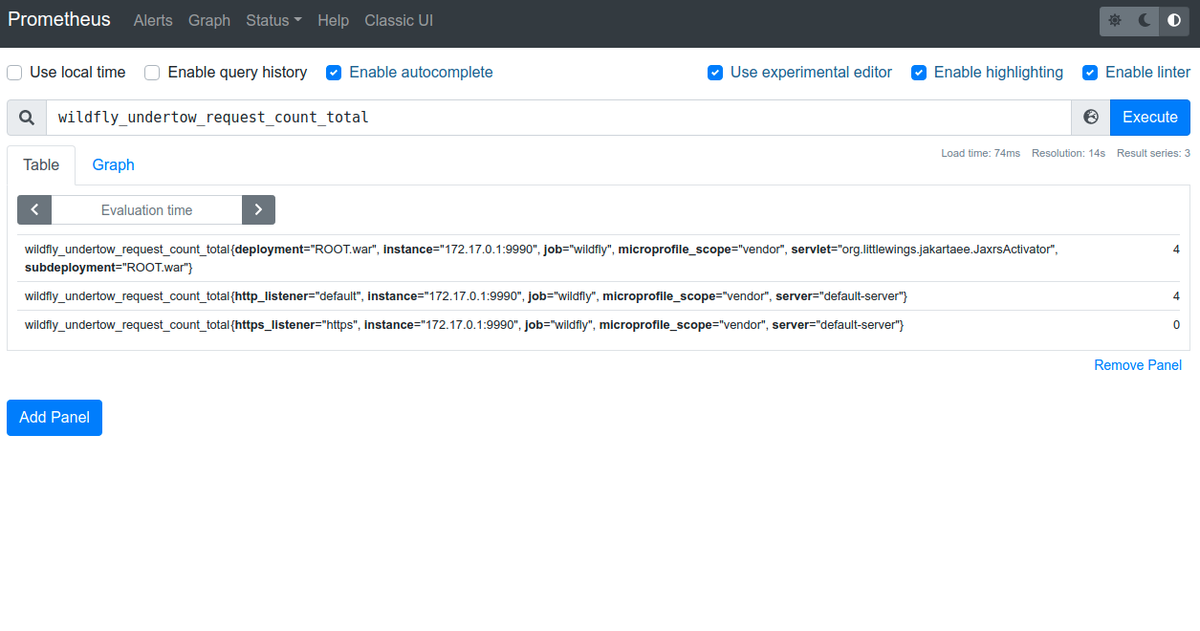
Prometheusでメトリクスを収集する設定や結果は、Metricsサブシステムの時と変わらないので割愛します。
※こちらも、/metricsエンドポイントの認証は無効にしています。
ちなみに、Metricsサブシステムの内容がベースになっているようなので、/metricsのパスが変更できないのも
同じようです。
まとめ
WildFlyのMetricsサブシステムおよびMicroProfile Metricsサブシステムを試してみました。
ざっくり使い方はわかった感じですね。
ただ、MicroProfile Metricsについてはアプリケーション独自のメトリクスを追加したりしていないので、そちらの確認は
今後といったところでしょうか。そのうち、やりましょう…。