これは、なにをしたくて書いたもの?
Python Call Graph(PyCallGraph)という、Pythonのプログラム内での関数呼び出しの様子を可視化してくれるツールが
あるようです。合わせて、関数の実行時間や呼び出し回数も見れる模様。
Python Call Graph — Python Call Graph 1.0.1 documentation
Pythonのプロファイリングについて調べていて、一緒に見つけました。
Pythonにおけるプロファイリング ― コードの高速化のために | POSTD
ただ、開発はすでに終了しているみたいです。
Retiring Projects | Gerald Kaszuba
現状でも動きはするようなので、軽くだけ試してみましょう。
環境
今回の環境は、こちらです。
$ lsb_release -a
No LSB modules are available.
Distributor ID: Ubuntu
Description:    Ubuntu 18.04.2 LTS
Release:    18.04
Codename:   bionic


$ python3 -V
Python 3.6.7
サンプルプログラム
試しに使ってみる、サンプルプログラムはこちらです。
profiling-example.py
def fib(n):
    if n == 0:
        return 0
    elif n == 1:
        return 1
    else:
        return fib(n - 1) + fib(n - 2)

def heavy_loop(n = 500000000):
    for i in range(n):
        calc()

    print("executed %d loop" % n)

def calc():
    1 + 2

def hello_world():
    print("Hello World!!")

def task(fib_num, heavy_loop_num):
    print("fib(%d) = %d" % (fib_num,fib(fib_num)))
    heavy_loop(heavy_loop_num)
    hello_world()

task(35, 10000000)
ここで使ったものを、そのまま使いました。
Python標準のcProfile、profileを使ってプロファイリングを試す - CLOVER🍀
実行にかかる時間は、これくらいです。
$ time python3 profiling-example.py
fib(35) = 9227465
executed 10000000 loop
Hello World!!

real    0m3.746s
user    0m3.737s
sys 0m0.008s
こちらを使って、Python Call Graphを試してみましょう。
Python Call Graphを試す
まずは、インストール。Graphvizなど、結果の出力で使うツールがインストールされている必要があります。今回はGraphvizを
利用します。
$ pip3 install pycallgraph
バージョン。
$ pip3 freeze
...
pycallgraph==1.0.1
実行は、「pycallgraph」コマンドで行います。すぐ後ろに可視化で使うツール(今回は「graphviz」)を指定します。
$ pycallgraph graphviz -- profiling-example.py
fib(35) = 9227465
executed 10000000 loop
Hello World!!
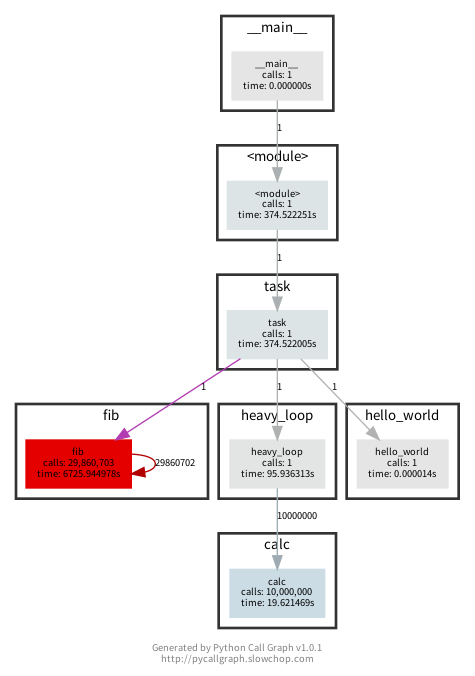
かなり時間がかかりますが、結果が出力されます。デフォルトでは、出力されるファイル名は「pycallgraph.png」です。

時間がかかったものは赤くなっていて、わかりやすいですね。
ちなみに、timeコマンド経由で実行すると、実行に6分くらいかかったみたいです…。
$ time pycallgraph graphviz -- profiling-example.py
fib(35) = 9227465
executed 10000000 loop
Hello World!!

real    6m14.682s
user    6m14.571s
sys 0m0.066s
ヘルプ。
$ pycallgraph --help
usage: pycallgraph [options] OUTPUT_TYPE [output_options] -- SCRIPT.py [ARG ...]

Python Call Graph profiles a Python script and generates a call graph
visualization.

positional arguments:
  {graphviz,gephi}      OUTPUT_TYPE
    graphviz            Graphviz generation
    gephi               Gephi GDF generation

optional arguments:
  -h, --help            show this help message and exit
  -v, --verbose         Display informative messages while running
  -d, --debug           Display debugging messages while running
  -t, --threaded        Process traces asyncronously (Experimental)
  -ng, --no-groups      Do not group functions by module
  -s, --stdlib          Include standard library functions in the trace
  -m, --memory          (Experimental) Track memory usage

filtering:
  -i INCLUDE, --include INCLUDE
                        Wildcard pattern of modules to include in the output.
                        You can have multiple include arguments.
  -e EXCLUDE, --exclude EXCLUDE
                        Wildcard pattern of modules to exclude in the output.
                        You can have multiple exclude arguments.
  --include-pycallgraph
                        Do not automatically filter out pycallgraph
  --max-depth MAX_DEPTH
                        Maximum stack depth to trace
可視化に使うツールまで指定すると、フォーマットの指定や出力ファイル名の指定などができることが確認できます。
$ pycallgraph graphviz --help
usage: pycallgraph [options] OUTPUT_TYPE [output_options] -- SCRIPT.py [ARG ...]

positional arguments:
  SCRIPT                The Python script file to profile
  ARG                   Python script arguments.

optional arguments:
  -h, --help            show this help message and exit
  -l TOOL, --tool TOOL  The tool from Graphviz to use, e.g. dot, neato, etc.
  -o OUTPUT_FILE, --output-file OUTPUT_FILE
                        The generated Graphviz file
  -f OUTPUT_FORMAT, --output-format OUTPUT_FORMAT
                        Image format to produce, e.g. png, ps, dot, etc. See
                        http://www.graphviz.org/doc/info/output.html for more.
  --font-name FONT_NAME
                        Name of the font to be used
  --font-size FONT_SIZE
                        Size of the font to be used
こんなところで。