これは、なにをしたくて書いたもの?
アプリケーションが通信相手の送信中または受信中のような時に、状況を確認する方法はないのかな?と思いまして。
スレッドダンプを取ってみた時にどうやら受信中のようだ、ということは推測できたりするのですが、実際のところ進んでいるのかそれとも
ただ単に待っているだけなのか確認する方法を知らないな、と。
iftop
どうやらこういう時はiftopを使うのがよさそうです。
iftop: display bandwidth usage on an interface
GitHub - soarpenguin/iftop: display bandwidth usage on an interface
通信相手のホストごとに、リアルタイムで情報が見れそうです。
こちらはオフィシャルサイトの画像です。

中央にホストと方向、その右の3列は通信レート(2秒ごと、10秒ごと、40秒ごと)だそうです。
TXは送信量、RXは受信量、TOTALは合計です。cumはiftop起動後の累計通信量、peakは過去40秒間のピーク速度、その右は平均通信レート
(2秒ごと、10秒ごと、40秒ごと)だそうです。
Linux - iftop コマンドでネットワークトラフィックの監視! - mk-mode BLOG
IFTopでホストのネットワーク通信状況を監視する(いろんなTop系コマンドを使ってみる その5)
通信相手ごとではありませんが、リアルタイムに情報を確認できるものにはこちらもありそうです。
GitHub - vergoh/vnstat: vnStat - a network traffic monitor for Linux and BSD
GitHub - rolandriegel/nload: Real-time network traffic monitor
GitHub - tgraf/bmon: bandwidth monitor and rate estimator
いずれにも言えそうなのですが、更新自体はもう随分前で止まっていそうな感じです(vnstatは比較的最近)。
また追加でインストールが必要なので、そういう場合はどうしたらいいのかなとも思うのですが。tcpdumpでしょうか。
ひとまず、iftopを確認してみましょう。
あと、BCCに含まれるtcptopも試してみました。
Rocky Linux 9.4でBPF Compiler Collection(BCC)のtcptopを使って転送状況を確認をしてみる - CLOVER🍀
環境
今回の環境はこちら。Ubuntu Linux 22.04 LTSです。
$ lsb_release -a
No LSB modules are available.
Distributor ID: Ubuntu
Description:    Ubuntu 22.04.4 LTS
Release:        22.04
Codename:       jammy


$ uname -srvmpio
Linux 5.15.0-112-generic #122-Ubuntu SMP Thu May 23 07:48:21 UTC 2024 x86_64 x86_64 x86_64 GNU/Linux
$ python3 --version
Python 3.10.12
iftopをインストールする
iftopはaptコマンドでインストールできます。
$ apt show iftop
Package: iftop
Version: 1.0~pre4-7
Priority: optional
Section: universe/net
Origin: Ubuntu
Maintainer: Ubuntu Developers <ubuntu-devel-discuss@lists.ubuntu.com>
Original-Maintainer: Markus Koschany <apo@debian.org>
Bugs: https://bugs.launchpad.net/ubuntu/+filebug
Installed-Size: 95.2 kB
Depends: libc6 (>= 2.29), libncurses6 (>= 6), libpcap0.8 (>= 0.9.8), libtinfo6 (>= 6)
Homepage: http://www.ex-parrot.com/~pdw/iftop/
Download-Size: 35.6 kB
APT-Sources: https://mirrors.edge.kernel.org/ubuntu jammy/universe amd64 Packages
Description: displays bandwidth usage information on an network interface
 iftop does for network usage what top(1) does for CPU usage. It listens to
 network traffic on a named interface and displays a table of current bandwidth
 usage by pairs of hosts. Handy for answering the question "Why is my Internet
 link so slow?".
インストール。
$ sudo apt install iftop
ヘルプ。
$ iftop -h
iftop: display bandwidth usage on an interface by host

Synopsis: iftop -h | [-npblNBP] [-i interface] [-f filter code]
                               [-F net/mask] [-G net6/mask6]

   -h                  display this message
   -n                  don't do hostname lookups
   -N                  don't convert port numbers to services
   -p                  run in promiscuous mode (show traffic between other
                       hosts on the same network segment)
   -b                  don't display a bar graph of traffic
   -B                  Display bandwidth in bytes
   -i interface        listen on named interface
   -f filter code      use filter code to select packets to count
                       (default: none, but only IP packets are counted)
   -F net/mask         show traffic flows in/out of IPv4 network
   -G net6/mask6       show traffic flows in/out of IPv6 network
   -l                  display and count link-local IPv6 traffic (default: off)
   -P                  show ports as well as hosts
   -m limit            sets the upper limit for the bandwidth scale
   -c config file      specifies an alternative configuration file
   -t                  use text interface without ncurses

   Sorting orders:
   -o 2s                Sort by first column (2s traffic average)
   -o 10s               Sort by second column (10s traffic average) [default]
   -o 40s               Sort by third column (40s traffic average)
   -o source            Sort by source address
   -o destination       Sort by destination address

   The following options are only available in combination with -t
   -s num              print one single text output afer num seconds, then quit
   -L num              number of lines to print

iftop, version 1.0pre4
copyright (c) 2002 Paul Warren <pdw@ex-parrot.com> and contributors
大きなファイルをダウンロードしてみる
今回はダウンロードで試してみたいと思います。
こういう時、自分は容量の大きいEclipseをテストに使ったりします。
Eclipse Downloads | The Eclipse Foundation
メインミラーからダウンロードしてみます。この時、リダイレクトが入ることに注意です。
$ curl -L 'https://www.eclipse.org/downloads/download.php?file=/technology/epp/downloads/release/2024-03/R/eclipse-java-2024-03-R-linux-gtk-x86_64.tar.gz&mirror_id=1' -o eclipse-java-2024-03-R-linux-gtk-x86_64.tar.gz
容量は322Mでした。
ひとまずiftopを起動します。管理者権限が必要です。
$ sudo iftop
すると、こんな表示になります。
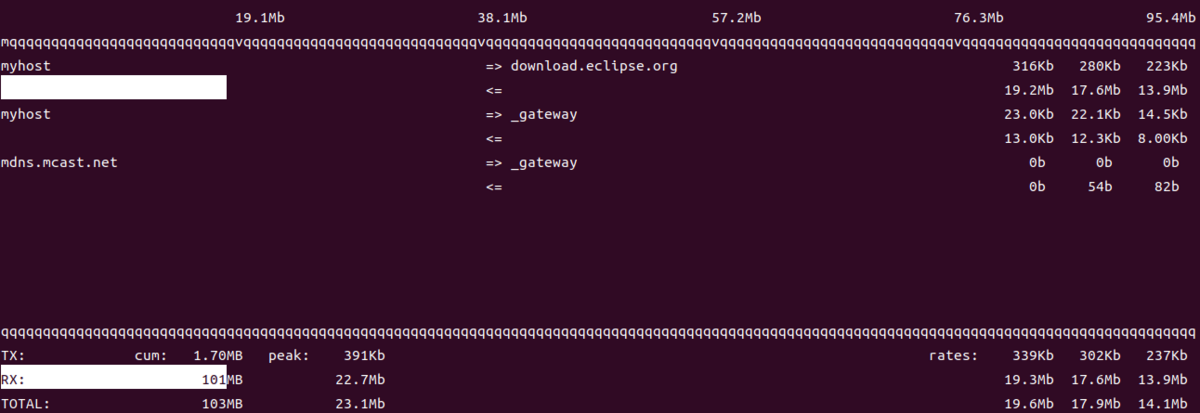
わかりやすいですね。
いくつかオプションを。
表示はビットレートになっているので、バイトにしたい場合は-Bを使います。
$ sudo iftop -B
ホスト名の逆引きを行わない場合は-n。
$ sudo iftop -n
ポートを表示する場合は-P、ポートからサービス名に逆引きしない場合は-N。
$ sudo iftop -P -N
ネットワークインターフェースを指定する場合は-i。
$ sudo iftop -i eth0
-fでフィルターが指定できます。
$ sudo iftop -f 'tcp and host 198.41.30.199 and port 443'
フィルターの構文はこちらですね。
pcap-filter(7) man page | TCPDUMP & LIBPCAP
応答を返さないサーバーにアクセスしてみる
次は、応答を返さないサーバーにアクセスしてみましょう。
60秒間応答を返さないHTTPサーバーをPythonで作成。
wait_httpd.py
from http.server import HTTPServer, BaseHTTPRequestHandler
from time import sleep

address = ("0.0.0.0", 8000)

class WaitHTTPRequestHandler(BaseHTTPRequestHandler):
    def do_GET(self):
        sleep(60)

        self.send_response(200)
        self.end_headers()
        self.wfile.write(b"Wait HTTP Server")

with HTTPServer(address, WaitHTTPRequestHandler) as server:
    server.serve_forever()
起動。このサーバーはIPアドレス192.168.0.6で動かすものとします。
$ python3 wait_httpd.py
先にiftopを仕込んで
$ sudo iftop -nNP -f 'tcp and host 192.168.0.6 and port 8000'
アクセス。
$ curl 192.168.0.6:8000
最初は通信が行われますが、その後は応答を返さないので転送量に現れなくなりますね。
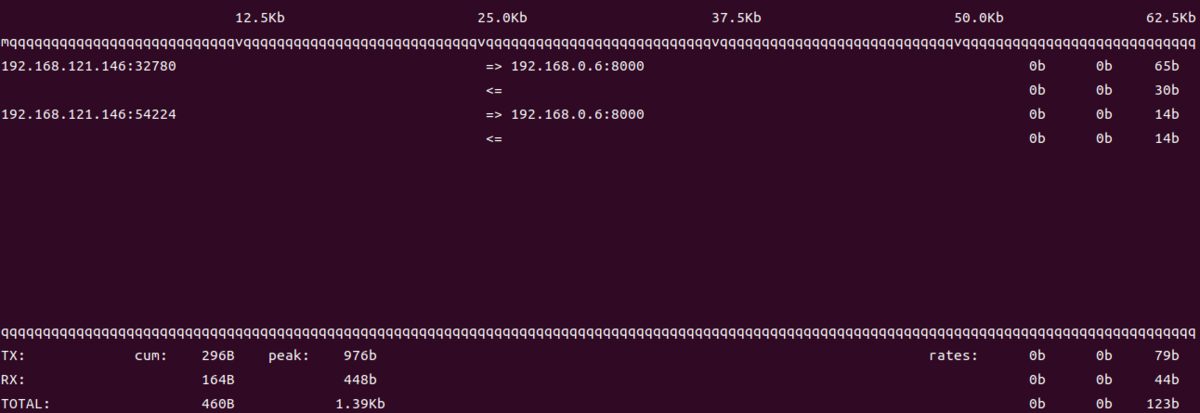
これで、通信が行われていない場合も確認できました。
tcpdump
iftopはインストールが必要なのですが、それよりは入っている箇所が多いのではないかと思われるtcpdumpでもできることはやってみましょう。
Eclipseをダウンロード。
$ curl -L 'https://www.eclipse.org/downloads/download.php?file=/technology/epp/downloads/release/2024-03/R/eclipse-java-2024-03-R-linux-gtk-x86_64.tar.gz&mirror_id=1' -o eclipse-java-2024-03-R-linux-gtk-x86_64.tar.gz
リダイレクトが行われダウンロードが始まったくらいで、通信先を確認。
$ ss -tn
通信先を指定してtcpdump。通信していることがわかればいいので、-sでパケットを絞っています。
$ sudo tcpdump -i any -n tcp and host 198.41.30.199 and port 443 -s 64
こんな感じでパケットが流れていきます。
00:12:13.757576 eth0  Out IP 192.168.121.146.33156 > 198.41.30.199.443: Flags [.], ack 10884616, win 24567, options [nop,nop,TS [|tcp]>
00:12:13.757838 eth0  In  IP 198.41.30.199.443 > 192.168.121.146.33156: Flags [.], seq 10884616:10886064, ack 1, win 61, options [nop,nop,TS [|tcp]>
00:12:13.757994 eth0  In  IP 198.41.30.199.443 > 192.168.121.146.33156: Flags [.], seq 10886064:10887512, ack 1, win 61, options [nop,nop,TS [|tcp]>
00:12:13.758002 eth0  Out IP 192.168.121.146.33156 > 198.41.30.199.443: Flags [.], ack 10887512, win 24567, options [nop,nop,TS [|tcp]>
00:12:13.758127 eth0  In  IP 198.41.30.199.443 > 192.168.121.146.33156: Flags [.], seq 10887512:10888960, ack 1, win 61, options [nop,nop,TS [|tcp]>
00:12:13.758241 eth0  In  IP 198.41.30.199.443 > 192.168.121.146.33156: Flags [.], seq 10888960:10890408, ack 1, win 61, options [nop,nop,TS [|tcp]>
次は、応答を返さないサーバーにアクセスしてみます。
先にtcpdumpを仕込んで
$ sudo tcpdump -i any -n tcp and host 192.168.0.6 and port 8000 -s 64
アクセス。
$ curl 192.168.0.6:8000
最初のやり取りは表示されますが、その後ピタリとパケットの流れが止まります。
00:13:03.749760 eth0  Out IP 192.168.121.146.47954 > 192.168.0.6.8000: Flags [S], seq 1569998229, win 64240, options [mss 1460, [|tcp]
00:13:03.750125 eth0  In  IP 192.168.0.6.8000 > 192.168.121.146.47954: Flags [S.], seq 1712696824, ack 1569998230, win 65160, options [mss 1460, [|tcp]
00:13:03.750207 eth0  Out IP 192.168.121.146.47954 > 192.168.0.6.8000: Flags [.], ack 1, win 502, options [nop,nop,TS [|tcp]>
00:13:03.750359 eth0  Out IP 192.168.121.146.47954 > 192.168.0.6.8000: Flags [P.], seq 1:81, ack 1, win 502, options [nop,nop,TS [|tcp]>
00:13:03.750629 eth0  In  IP 192.168.0.6.8000 > 192.168.121.146.47954: Flags [.], ack 81, win 509, options [nop,nop,TS [|tcp]>
確認としては、こういうやり方もあるのかなと。
おわりに
Linuxでネットワークの転送状況を確認したいということで、主にiftopを使って試してみました。
こういうツールで確認できると状況がわかりやすくてよいですね。使えない場合は、tcpdumpあたりで確認することも押さえておこうかなと…。