これは、なにをしたくて書いたもの?
前にJavaでOpenTelemetryのトレースを試してみました。
https://kazuhira-r.hatenablog.com/entry/2022/02/11/005344
OpenTelemetryに慣れていきたいなと思うのですが、他の言語でも試してみようかなということで。
今回はNode.jsで試してみることにしました。
OpenTelemetry
OpenTelemetryのWebサイトはこちら。
OpenTelemetryはツール、API、SDKのコレクションであり、テレメトリーデータ(メトリクス、ログ、トレース)を
計測、生成、収集およびエクスポートして、ソフトウェアのパフォーマンスと動作の分析に役立てるものとされています。
OpenTelemetry is a collection of APIs, SDKs, and tools. Use it to instrument, generate, collect, and export telemetry data (metrics, logs, and traces) to help you analyze your software’s performance and behavior.
ドキュメントはこちら。
コンセプトや構成要素、データソースについては、こちらに1度書きました。
OpenTelemetry/Jaeger/JAX-RS/MySQLで、Distributed Tracing - CLOVER🍀
ドキュメントへの参照も載せておきましょう。
OpenTelemetry Concepts | OpenTelemetry
言語ごとのinstrumentationを見ていきます。
Instrumentation | OpenTelemetry
現時点で、トレース、メトリクス、ログがすべてStableなのは、JavaとC#/.NETだけのようですね。
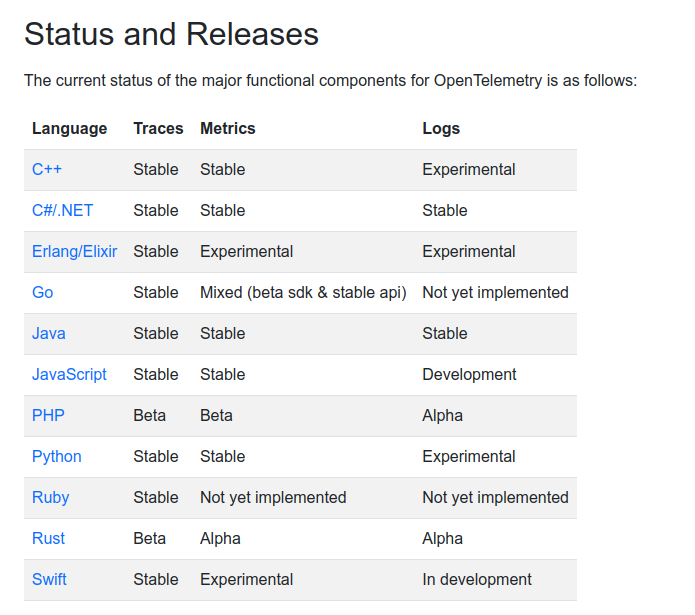
今回はJavaScript(Node.js)でトレースを使うことにしましょう。
OpenTelemetry JavaScript Instrumentation
JavaScriptのinstrumentationのドキュメントはこちら。
Getting Startedを見ると、JavaScriptはNode.jsとブラウザの2種類の組み込み方があることがわかります。
Getting Started | OpenTelemetry
Node.jsの方は、Expressに組み込む例が書かれています。
ブラウザ向けの方は、実験的かつ仕様もほぼ決まっていないようです。
Client instrumentation for the browser is experimental and mostly unspecified
アプリケーションに組み込むには、instrumentationライブラリーを使って自動的に組み込むか、言語ごとのSdKを使って手動で組み込む
2つの方法があります。
Automatic Instrumentation | OpenTelemetry
今回は、instrumentationライブラリーを見ていきます。
Express等のフレームワーク、ライブラリーに対応したinstrumentationライブラリーがあるのですが、auto-instrumentations-nodeという
メタパッケージを使うことですべてのinstrumentationライブラリーを組み込むことができます。
Note, that using those metapackages increases your dependency graph size. Use individual instrumentation packages if you know exactly which ones you need.
Using instrumentation libraries | OpenTelemetry
すべてのinsutrumentationライブラリーが組み込まれるということは、当然モジュールのサイズが大きくなります。それが問題になる場合は、
個々のinstrumentationライブラリーを組み込みます。
今回はauto-instrumentations-nodeを使うことにします。
instrumentationライブラリー自体はどこにあるかというと、こちらです。
auto-instrumentations-nodeはこちら。
サポートされているフレームワークやライブラリーは、以下にリストアップされています。
OpenTelemetry Meta Packages for Node
各instrumentationライブラリーは、以下にあります。
https://github.com/open-telemetry/opentelemetry-js/tree/experimental/v0.41.2/experimental/packages
サンプルはこちら。
また、こちらで検索することもできます。
お題
今回は、Node.jsとRedisを使って以下の構成のアプリケーションを作ってみます。
api-a [Node.js/Express - axios] → api-b [Node.js/Express - ioredis] → Redis
アプリケーションを2つ用意することになりますね。これらにNode.jsのinstrumentationライブラリーを組み込みます。
一方で、テレメトリーデータの流れは以下になるようにします。
OpenTelemetry Collector Agent [api-a、api-b] → OpenTelemetry Collector → Jaeger
OpenTelemetryのエージェント(Node.jsアプリケーション)がOpenTelemetry Collectorにデータを送り、OpenTelemetry Collectorから
Jaegerにデータをエクスポートします。
環境
今回の環境は、こちら。Ubuntu Linux 22.04 LTSです。
$ lsb_release -a
No LSB modules are available.
Distributor ID: Ubuntu
Description:    Ubuntu 22.04.3 LTS
Release:        22.04
Codename:       jammy


$ uname -srvmpio
Linux 5.15.0-83-generic #92-Ubuntu SMP Mon Aug 14 09:30:42 UTC 2023 x86_64 x86_64 x86_64 GNU/Linux
Node.jsのバージョン。
$ node --version
v18.17.1


$ npm --version
9.6.7
Redisのバージョン。
$ bin/redis-server --version
Redis server v=7.2.1 sha=00000000:0 malloc=jemalloc-5.3.0 bits=64 build=81a2b5148e5873e4
Redisは、以下のコマンドで起動しているものとします。
$ bin/redis-server --bind '0.0.0.0' --requirepass redispass
各サーバーのIPアドレスは、以下のようになっているものとします。
- api-a … 172.17.0.2
- api-b … 172.17.0.3
- Redis … 172.17.0.4
- OpenTelemetry Collector … 172.17.0.4
- Jaeger … 172.17.0.6
OpenTelemetry CollectorとJaegerをインストールする
まずはOpenTelemetry CollectorとJaegerをインストールしておきましょう。
OpenTelemetry Collectorは、こちらからダウンロードします。
Releases · open-telemetry/opentelemetry-collector-releases · GitHub
$ curl -LO https://github.com/open-telemetry/opentelemetry-collector-releases/releases/download/v0.84.0/otelcol-contrib_0.84.0_linux_386.tar.gz
$ tar xf otelcol-contrib_0.84.0_linux_386.tar.gz
設定ファイルは、こちらのページを見て作成。
こうしました。
otel-collector-config.yaml
receivers:
  otlp:
    protocols:
      http:

processors:
  batch:

exporters:
  logging:
    loglevel: debug
  jaeger:
    endpoint: 172.17.0.6:14250
    tls:
      insecure: true

extensions:
  health_check:
  pprof:
  zpages:

service:
  extensions: [health_check, pprof, zpages]
  pipelines:
    traces:
      receivers: [otlp]
      processors: [batch]
      exporters: [logging, jaeger]
#    metrics:
#      receivers: [otlp]
#      processors: [batch]
#      exporters: [otlp]
#    logs:
#      receivers: [otlp]
#      processors: [batch]
#      exporters: [otlp]
今回は、メトリクスとログは使いません。
設定ファイルのサンプルは、こちらにもあります。
起動。
$ ./otelcol-contrib --config otel-collector-config.yaml
続いて、Jaeger。こちらはダウンロードして
$ curl -LO https://github.com/jaegertracing/jaeger/releases/download/v1.49.0/jaeger-1.49.0-linux-amd64.tar.gz
$ tar xf jaeger-1.49.0-linux-amd64.tar.gz
$ cd jaeger-1.49.0-linux-amd64
起動するだけです。
$ ./jaeger-all-in-one
アプリケーションを作成する
では、アプリケーションを作成していきましょう。
api-a
api-aの作成。こちらは、api-bをHTTPで呼び出すアプリケーションです。
Node.jsプロジェクトの作成。
$ npm init -y
$ npm i -D typescript
$ npm i -D @types/node@v18
$ npm i -D prettier
$ mkdir src
Expressのインストール。
$ npm i express
$ npm i -D @types/express
Axiosのインストール。
$ npm i axios
この時点の依存関係はこちら。
  "devDependencies": {
    "@types/express": "^4.17.17",
    "@types/node": "^18.17.15",
    "prettier": "^3.0.3",
    "typescript": "^5.2.2"
  },
  "dependencies": {
    "axios": "^1.5.0",
    "express": "^4.18.2"
  },
scripts。
  "scripts": {
    "build": "tsc --project .",
    "build:watch": "tsc --project . --watch",
    "format": "prettier --write src"
  },
各種設定ファイル。
tsconfig.json
{
  "compilerOptions": {
    "target": "esnext",
    "module": "commonjs",
    "moduleResolution": "node",
    "lib": ["esnext"],
    "baseUrl": "./src",
    "outDir": "dist",
    "strict": true,
    "forceConsistentCasingInFileNames": true,
    "noFallthroughCasesInSwitch": true,
    "noImplicitOverride": true,
    "noImplicitReturns": true,
    "noPropertyAccessFromIndexSignature": true,
    "esModuleInterop": true
  },
  "include": [
    "src"
  ]
}
.prettierrc.json
{
  "singleQuote": true,
  "printWidth": 120
}
ソースコードはこちらで用意。
src/index.ts
import axios from 'axios';
import express from 'express';

const app = express();
app.use(express.text());

const anotherApiTarget = '172.17.0.3:5000';

app.get('/:id', async (req, res) => {
  const id = req.params['id'];

  const apiResponse = await axios({
    method: 'get',
    headers: { 'Content-Type': 'text/plain' },
    url: `http://${anotherApiTarget}/${id}`,
  });

  const data = apiResponse.data;

  res.contentType('text/plain');
  res.send(data);
});

app.post('/:id', async (req, res) => {
  const id = req.params['id'];
  const body = req.body;

  const apiResponse = await axios({
    method: 'post',
    headers: { 'Content-Type': 'text/plain' },
    url: `http://${anotherApiTarget}/${id}`,
    data: body,
  });

  const data = apiResponse.data;

  res.contentType('text/plain');
  res.send(data);
});

const port = 3000;

app.listen(port, () => {
  console.log(`[${new Date().toISOString()}] start server[${port}]`);
});
アクセスされた内容を、そのままapi-bに渡して呼び出すだけのアプリケーションです。
api-b
続いて、api-b。こちらは、Redisへアクセスするアプリケーションです。
Node.jsプロジェクトの作成。
$ npm init -y
$ npm i -D typescript
$ npm i -D @types/node@v18
$ npm i -D prettier
$ mkdir src
Expressのインストール。
$ npm i express
$ npm i -D @types/express
ioredisのインストール。
$ npm i ioredis
この時点の依存関係は、こちら。
  "devDependencies": {
    "@types/express": "^4.17.17",
    "@types/node": "^18.17.15",
    "prettier": "^3.0.3",
    "typescript": "^5.2.2"
  },
  "dependencies": {
    "express": "^4.18.2",
    "ioredis": "^5.3.2"
  }
設定ファイルは同じなので、省略します。
src/index.ts
import express from 'express';
import Redis from 'ioredis';

const app = express();
app.use(express.text());

const redis = new Redis({
  host: '172.17.0.4',
  port: 6379,
  password: 'redispass',
  db: 0,
});

app.get('/:id', async (req, res) => {
  const id = req.params['id'];

  const data = await redis.get(id);

  res.contentType('text/plain');
  res.send(data);
});

app.post('/:id', async (req, res) => {
  const id = req.params['id'];
  const body = req.body;

  await redis.set(id, body);

  res.contentType('text/plain');
  res.send(body);
});

const port = 5000;

app.listen(port, () => {
  console.log(`[${new Date().toISOString()}] start server[${port}]`);
});
Redisにset、getするだけのアプリケーションです。
動作確認
作成したアプリケーションの動作確認を行います。
それぞれビルドして起動。
## api-a
$ npm run build
$ node dist/index.js
[2023-09-10T13:11:44.215Z] start server[3000]


## api-b
$ npm run build
$ node dist/index.js
[2023-09-10T13:11:51.740Z] start server[5000]
確認。
## 1セット目
$ curl -XPOST -H 'Content-Type: text/plain' 172.17.0.2:3000/foo -d 'Hello World'
Hello World

$ curl 172.17.0.2:3000/foo
Hello World


## 2セット目
$ curl -XPOST -H 'Content-Type: text/plain' 172.17.0.2:3000/bar -d 'Hello OpenTelemetry'
Hello OpenTelemetry

$ curl 172.17.0.2:3000/bar
Hello OpenTelemetry
OKですね。
ここでアプリケーションを1度終了しておきます。
OpenTelemetryのinstrumentationライブラリーを追加して、トレーシングを行う
それでは、アプリケーションにOpenTelemetryのinstrumentationライブラリーを追加しましょう。
Automatic Instrumentation | OpenTelemetry
2つのアプリケーションに、それぞれ以下の依存関係を追加します。
$ npm i @opentelemetry/api
$ npm i @opentelemetry/auto-instrumentations-node
api-aの依存関係はこうなりました。
  "dependencies": {
    "@opentelemetry/api": "^1.4.1",
    "@opentelemetry/auto-instrumentations-node": "^0.39.2",
    "axios": "^1.5.0",
    "express": "^4.18.2"
  },
  "devDependencies": {
    "@types/express": "^4.17.17",
    "@types/node": "^18.17.15",
    "prettier": "^3.0.3",
    "typescript": "^5.2.2"
  },
api-b。
  "devDependencies": {
    "@types/express": "^4.17.17",
    "@types/node": "^18.17.15",
    "prettier": "^3.0.3",
    "typescript": "^5.2.2"
  },
  "dependencies": {
    "@opentelemetry/api": "^1.4.1",
    "@opentelemetry/auto-instrumentations-node": "^0.39.2",
    "express": "^4.18.2",
    "ioredis": "^5.3.2"
  }
次に、環境変数を設定します。
Automatic Instrumentation | OpenTelemetry
api-a。
$ export OTEL_TRACES_EXPORTER=otlp
$ export OTEL_METRICS_EXPORTER=none
$ export OTEL_LOGS_EXPORTER=none
$ export OTEL_EXPORTER_OTLP_ENDPOINT=http://172.17.0.5:4318
$ export OTEL_NODE_RESOURCE_DETECTORS='env,host,os,process,container'
$ export OTEL_SERVICE_NAME=api-a
$ export NODE_OPTIONS='-r @opentelemetry/auto-instrumentations-node/register'
api-b。
$ export OTEL_TRACES_EXPORTER=otlp
$ export OTEL_METRICS_EXPORTER=none
$ export OTEL_LOGS_EXPORTER=none
$ export OTEL_EXPORTER_OTLP_ENDPOINT=http://172.17.0.5:4318
$ export OTEL_NODE_RESOURCE_DETECTORS='env,host,os,process,container'
$ export OTEL_SERVICE_NAME=api-b
$ export NODE_OPTIONS='-r @opentelemetry/auto-instrumentations-node/register'
それぞれ、トレースのエクスポーター名、OpenTelemetry Collectorのエンドポイント、Node.jsで収集するリソース、サービス名、
Node.jsのオプションを指定します。
OTEL_NODE_RESOURCE_DETECTORSに指定できる値は、こちらに記載があります。有効にするリソース検出機能を指定します。
Automatic Instrumentation Configuration | OpenTelemetry
NODE_OPTIONSで指定しているのは-r(--require)で、auto-instrumentations-nodeモジュールをアプリケーションの実行前に
登録するようにしています。
$ export NODE_OPTIONS='-r @opentelemetry/auto-instrumentations-node/register'
指定されているのは、こちら(がビルドされたもの)ですね。
では、アプリケーションをそれぞれ起動します。
api-a。
$ node dist/index.js
Unable to initialize instrumentation for lambda. Cannot identify lambda handler or task root. { taskRoot: undefined, handlerDef: undefined }
@opentelemetry/instrumentation-grpc Module @grpc/grpc-js has been loaded before @opentelemetry/instrumentation-grpc so it might not work, please initialize it before requiring @grpc/grpc-js
OpenTelemetry automatic instrumentation started successfully
[2023-09-10T13:43:42.908Z] start server[3000]
api-b。
$ node dist/index.js
Unable to initialize instrumentation for lambda. Cannot identify lambda handler or task root. { taskRoot: undefined, handlerDef: undefined }
@opentelemetry/instrumentation-grpc Module @grpc/grpc-js has been loaded before @opentelemetry/instrumentation-grpc so it might not work, please initialize it before requiring @grpc/grpc-js
OpenTelemetry automatic instrumentation started successfully
[2023-09-10T13:43:54.530Z] start server[5000]
動作確認した時のコマンドを、もう1度実行します。
## 1セット目
$ curl -XPOST -H 'Content-Type: text/plain' 172.17.0.2:3000/foo -d 'Hello World'
Hello World

$ curl 172.17.0.2:3000/foo
Hello World


## 2セット目
$ curl -XPOST -H 'Content-Type: text/plain' 172.17.0.2:3000/bar -d 'Hello OpenTelemetry'
Hello OpenTelemetry

$ curl 172.17.0.2:3000/bar
Hello OpenTelemetry
この時、OpenTelemetry Collectorのトレース用のエクスポーターにloggingを指定していたので
    traces:
      receivers: [otlp]
      processors: [batch]
      exporters: [logging, jaeger]
標準出力にログ出力が行われます。
2023-09-10T13:44:35.263Z        info    TracesExporter  {"kind": "exporter", "data_type": "traces", "name": "logging", "resource spans": 2, "spans": 274}
2023-09-10T13:44:35.265Z        info    ResourceSpans #0
Resource SchemaURL:
Resource attributes:
     -> service.name: Str(api-a)
     -> telemetry.sdk.language: Str(nodejs)
     -> telemetry.sdk.name: Str(opentelemetry)
     -> telemetry.sdk.version: Str(1.15.2)
     -> host.name: Str(4c6b959a4813)
     -> host.arch: Str(amd64)
     -> os.type: Str(linux)
     -> os.version: Str(5.15.0-83-generic)
     -> process.pid: Int(10)
     -> process.executable.name: Str(node)
     -> process.executable.path: Str(/usr/local/bin/node)
     -> process.command_args: Slice(["/usr/local/bin/node","/host/dist/index.js"])
     -> process.runtime.version: Str(18.17.1)
     -> process.runtime.name: Str(nodejs)
     -> process.runtime.description: Str(Node.js)
     -> process.command: Str(/host/dist/index.js)
     -> process.owner: Str(root)
     -> container.id: Str(4c6b959a48131281774ca882cd48d13f7fa101292c4fdaba1cb6d9512ae8279c)
ScopeSpans #0
ScopeSpans SchemaURL:
InstrumentationScope @opentelemetry/instrumentation-express 0.33.1
Span #0
    Trace ID       : af0185f48699f89665530099b3b40b99
    Parent ID      : 37c3410962cabf7d
    ID             : 659e4db256207700
    Name           : middleware - query
    Kind           : Internal
    Start time     : 2023-09-10 13:44:30.073999872 +0000 UTC
    End time       : 2023-09-10 13:44:30.074353408 +0000 UTC
    Status code    : Unset
    Status message :
Attributes:
     -> http.route: Str(/)
     -> express.name: Str(query)
     -> express.type: Str(middleware)
Span #1
    Trace ID       : af0185f48699f89665530099b3b40b99
    Parent ID      : 37c3410962cabf7d
    ID             : 9badd350a036fedb
    Name           : middleware - expressInit
    Kind           : Internal
    Start time     : 2023-09-10 13:44:30.073999872 +0000 UTC
    End time       : 2023-09-10 13:44:30.074142976 +0000 UTC
    Status code    : Unset
    Status message :
Attributes:
     -> http.route: Str(/)
     -> express.name: Str(expressInit)
     -> express.type: Str(middleware)
Span #2
    Trace ID       : af0185f48699f89665530099b3b40b99
    Parent ID      : 37c3410962cabf7d
    ID             : 187778470bf7ef67
    Name           : middleware - textParser
    Kind           : Internal
    Start time     : 2023-09-10 13:44:30.075000064 +0000 UTC
    End time       : 2023-09-10 13:44:30.10999552 +0000 UTC
    Status code    : Unset
    Status message :
Attributes:
     -> http.route: Str(/)
     -> express.name: Str(textParser)
     -> express.type: Str(middleware)
Span #3
    Trace ID       : af0185f48699f89665530099b3b40b99
    Parent ID      : 37c3410962cabf7d
    ID             : f800d6e43ecf2450
    Name           : request handler - /:id
    Kind           : Internal
    Start time     : 2023-09-10 13:44:30.110000128 +0000 UTC
    End time       : 2023-09-10 13:44:30.110024704 +0000 UTC
    Status code    : Unset
    Status message :
Attributes:
     -> http.route: Str(/:id)
     -> express.name: Str(/:id)
     -> express.type: Str(request_handler)
Span #4
    Trace ID       : 2b18529d370ae8c11365421e84982941
    Parent ID      : 19714ca57cca6501
    ID             : a0f2226e6243c28c
    Name           : middleware - query
    Kind           : Internal
    Start time     : 2023-09-10 13:44:33.296 +0000 UTC
    End time       : 2023-09-10 13:44:33.296233472 +0000 UTC
    Status code    : Unset
    Status message :
Attributes:
     -> http.route: Str(/)
     -> express.name: Str(query)
     -> express.type: Str(middleware)
Span #5
    Trace ID       : 2b18529d370ae8c11365421e84982941
    Parent ID      : 19714ca57cca6501
    ID             : d0d508243bcb9512
    Name           : middleware - expressInit
    Kind           : Internal
    Start time     : 2023-09-10 13:44:33.296 +0000 UTC
    End time       : 2023-09-10 13:44:33.296146432 +0000 UTC
    Status code    : Unset
    Status message :
Attributes:
     -> http.route: Str(/)
     -> express.name: Str(expressInit)
     -> express.type: Str(middleware)
Span #6
    Trace ID       : 2b18529d370ae8c11365421e84982941
    Parent ID      : 19714ca57cca6501
    ID             : bebff8ab7d1d4df0
    Name           : middleware - textParser
    Kind           : Internal
    Start time     : 2023-09-10 13:44:33.296 +0000 UTC
    End time       : 2023-09-10 13:44:33.296095232 +0000 UTC
    Status code    : Unset
    Status message :
Attributes:
     -> http.route: Str(/)
     -> express.name: Str(textParser)
     -> express.type: Str(middleware)
Span #7
    Trace ID       : 2b18529d370ae8c11365421e84982941
    Parent ID      : 19714ca57cca6501
    ID             : 81dc2a843298cd9c
    Name           : request handler - /:id
    Kind           : Internal
    Start time     : 2023-09-10 13:44:33.296999936 +0000 UTC
    End time       : 2023-09-10 13:44:33.297020928 +0000 UTC
    Status code    : Unset
    Status message :
Attributes:
     -> http.route: Str(/:id)
     -> express.name: Str(/:id)
     -> express.type: Str(request_handler)
ScopeSpans #1
ScopeSpans SchemaURL:
InstrumentationScope @opentelemetry/instrumentation-fs 0.8.1
Span #0
    Trace ID       : af0185f48699f89665530099b3b40b99
    Parent ID      : 37c3410962cabf7d
    ID             : 2e2c267b570cece5
    Name           : fs realpathSync
    Kind           : Internal
    Start time     : 2023-09-10 13:44:30.076999936 +0000 UTC
    End time       : 2023-09-10 13:44:30.077081856 +0000 UTC
    Status code    : Unset
    Status message :
Span #1
    Trace ID       : af0185f48699f89665530099b3b40b99
    Parent ID      : 37c3410962cabf7d
    ID             : 1069e2d2779bd261
    Name           : fs readFileSync
    Kind           : Internal
    Start time     : 2023-09-10 13:44:30.076999936 +0000 UTC
    End time       : 2023-09-10 13:44:30.077584384 +0000 UTC
    Status code    : Unset
    Status message :
Span #2
    Trace ID       : af0185f48699f89665530099b3b40b99
    Parent ID      : 37c3410962cabf7d
    ID             : 8ff087d01743abde
    Name           : fs realpathSync
    Kind           : Internal
    Start time     : 2023-09-10 13:44:30.078000128 +0000 UTC
    End time       : 2023-09-10 13:44:30.078066944 +0000 UTC
    Status code    : Unset
    Status message :
Span #3
    Trace ID       : af0185f48699f89665530099b3b40b99
    Parent ID      : 37c3410962cabf7d
    ID             : 35f3875a31231c27
    Name           : fs readFileSync
    Kind           : Internal
    Start time     : 2023-09-10 13:44:30.078000128 +0000 UTC
    End time       : 2023-09-10 13:44:30.078881024 +0000 UTC
    Status code    : Unset
    Status message :
Span #4
    Trace ID       : af0185f48699f89665530099b3b40b99
    Parent ID      : 37c3410962cabf7d
    ID             : 011b3a0be7bf57af
    Name           : fs realpathSync
    Kind           : Internal
    Start time     : 2023-09-10 13:44:30.079000064 +0000 UTC
    End time       : 2023-09-10 13:44:30.079028992 +0000 UTC
    Status code    : Unset
    Status message :
Span #5
    Trace ID       : af0185f48699f89665530099b3b40b99
    Parent ID      : 37c3410962cabf7d
    ID             : 5225cd698cb78472
    Name           : fs statSync
    Kind           : Internal
    Start time     : 2023-09-10 13:44:30.08 +0000 UTC
    End time       : 2023-09-10 13:44:30.08004224 +0000 UTC
    Status code    : Unset
    Status message :
Span #6
    Trace ID       : af0185f48699f89665530099b3b40b99
    Parent ID      : 37c3410962cabf7d
    ID             : 68189d6d7c681331
    Name           : fs statSync
    Kind           : Internal
    Start time     : 2023-09-10 13:44:30.08 +0000 UTC
    End time       : 2023-09-10 13:44:30.080021248 +0000 UTC
    Status code    : Unset
    Status message :
Span #7
    Trace ID       : af0185f48699f89665530099b3b40b99
    Parent ID      : 37c3410962cabf7d
    ID             : dd7e5b922a9b3317
    Name           : fs statSync
    Kind           : Internal
    Start time     : 2023-09-10 13:44:30.08 +0000 UTC
    End time       : 2023-09-10 13:44:30.080056064 +0000 UTC
    Status code    : Unset
    Status message :
Span #8
    Trace ID       : af0185f48699f89665530099b3b40b99
    Parent ID      : 37c3410962cabf7d
    ID             : ad91deb4b23e306a
    Name           : fs statSync
    Kind           : Internal
    Start time     : 2023-09-10 13:44:30.08 +0000 UTC
    End time       : 2023-09-10 13:44:30.08002432 +0000 UTC
    Status code    : Unset
    Status message :
Span #9
    Trace ID       : af0185f48699f89665530099b3b40b99
    Parent ID      : 37c3410962cabf7d
    ID             : e335fdf9884553b2
    Name           : fs statSync
    Kind           : Internal
    Start time     : 2023-09-10 13:44:30.08 +0000 UTC
    End time       : 2023-09-10 13:44:30.080022272 +0000 UTC
    Status code    : Unset
    Status message :
Span #10
    Trace ID       : af0185f48699f89665530099b3b40b99
    Parent ID      : 37c3410962cabf7d
    ID             : a604af9a0ca97445
    Name           : fs statSync
    Kind           : Internal
    Start time     : 2023-09-10 13:44:30.080999936 +0000 UTC
    End time       : 2023-09-10 13:44:30.081023232 +0000 UTC
    Status code    : Unset
    Status message :

〜省略〜
では、Jaegerに送信されたデータを見てみましょう。
http://[Jaegerが動作しているホスト]:16686/にアクセスしてWeb UIを表示してみると、2つのサービス(Jaeger自身を含めると3つ)が
認識されていることが確認できます。

Serviceで「api-a」を選んで、「Find Traces」ボタンを押してみます。

表示したいトレースデータを選択してみましょう。
「api-a: POST /:id」を選択してみます。

Spanを開いてみます。

TagsやProcessも開けます。

Redisへのアクセスも記録されていますね。

どのinstrumentationライブラリーによって記録されたかは、Tagsのotel.library.nameを見ればわかりそうです。

今回は、それぞれ以下で記録されています。
- Express
- axios
- ioredis
最後にサービス間の依存関係を表示して、おわりにしましょう。

おわりに
Node.jsを使って、OpenTelemetryでトレースをしてみました。
Javaで1度やっていたのでOpenTelemetry Collactorの方はまだよかったですが、Node.jsのinstrumentationライブラリーまわりはいろいろ
調べて回ったのでそれなりに苦労しました。
ただ試しているだけなのに、必要以上に追いすぎているのではという気がしないでもないですが。
Node.jsで使うOpenTelemetryもまだいくつか試してみたいことがあるのですが、Javaと合わせてもうちょっと慣れていくとしましょうか。